
COVID-19 and pulse oximeter
A good way to know the severity of Covid-19 is to use a passel oximeter. However, there is a global shortage of pulse oximeters. I have built a pulse oximeter using the MAX30102 sensor. This could be helpful if my family member gets infected.
How to connect the ESP8266 to MAX3012

MAX80102 sensor connects to ESP8366 using the I2C interface. The connection was made by referring to the following figure. 3.3k Ohm resistance is also available at 3.3-10k ohms
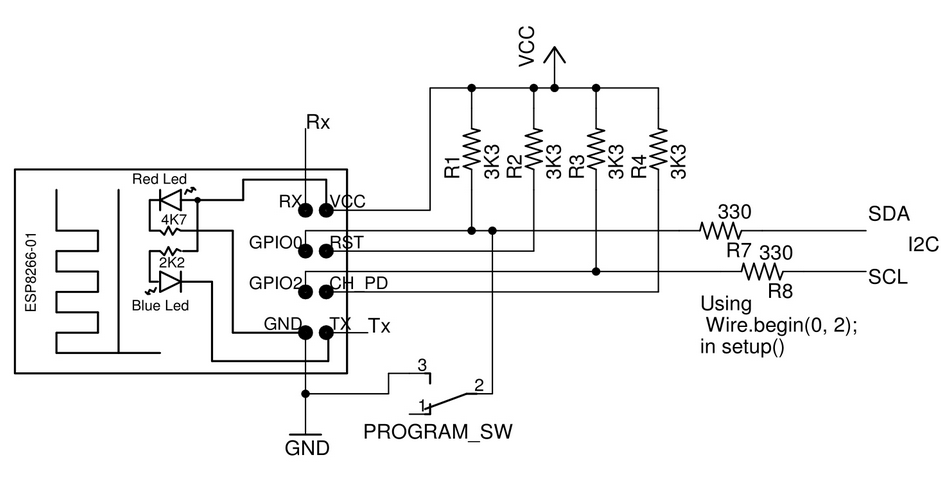
You have to remember to do the i2c setup with the Wire library.
Wire.begin(0,2);
The sensor I purchased was the following
In order to use MAX30102, you need to install Sparkfun’s library.

I tried to run a sample program (Example8_SPO2).
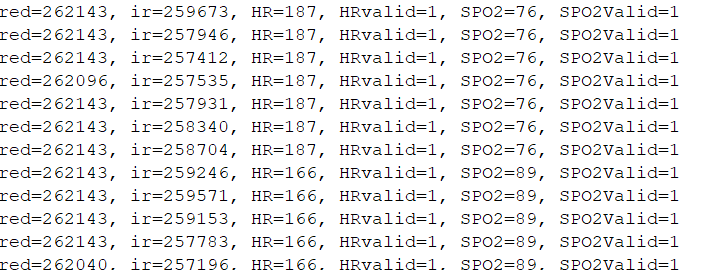
HR=166… SPO2=76-89…
This vital sign is a dead man!!
I scrutinized the content of the program. The code to find SPO2 is included in spo2_algorithm.cpp.
It’s too difficult for me to understand !!
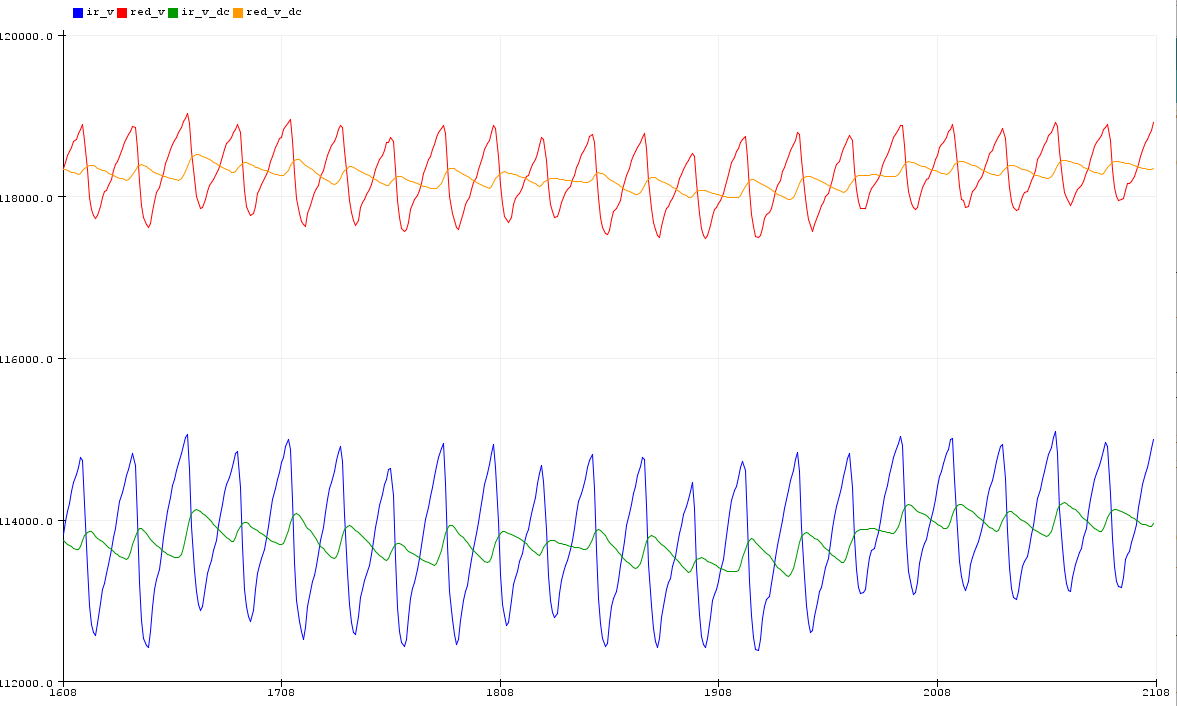
However, direct observation of the sensor values appears to be coming in exactly the get. The code below is a test sketch to get the sensor data.
|
1 2 3 4 5 6 7 8 9 10 11 12 13 14 15 16 17 18 19 20 21 22 23 24 25 26 27 28 29 30 31 32 33 34 35 36 37 38 39 40 41 42 43 |
#include <Wire.h> #include "MAX30105.h" MAX30105 particleSensor; void setup() { Wire.begin(0,2); // I2Cのピン設定 Serial.begin(115200); Serial.println(""); Serial.println("Initializing..."); // Initialize sensor while(!particleSensor.begin(Wire, I2C_SPEED_FAST)){ Serial.print("."); } Serial.println("OK!"); //Setup to sense a nice looking saw tooth on the plotter byte ledBrightness = 0x1F; //Options: 0=Off to 255=50mA byte sampleAverage = 8; //Options: 1, 2, 4, 8, 16, 32 byte ledMode = 2; //Options: 1 = Red only, 2 = Red + IR, 3 = Red + IR + Green int sampleRate = 400; //Options: 50, 100, 200, 400, 800, 1000, 1600, 3200 int pulseWidth = 411; //Options: 69, 118, 215, 411 int adcRange = 4096; //Options: 2048, 4096, 8192, 16384 particleSensor.setup(ledBrightness, sampleAverage, ledMode, sampleRate, pulseWidth, adcRange); //Configure sensor with these settings Serial.println("ir,red"); } void loop() { uint32_t ir_v = particleSensor.getIR(); uint32_t red_v = particleSensor.getRed(); Serial.print(ir_v); Serial.print(","); Serial.println(red_v); } |
The RED and IR pulses need to be analyzed to obtain SPO2. So I’ve been gathering information from net.

https://arxiv.org/ftp/arxiv/papers/1907/1907.11989.pdf

 (抜粋)
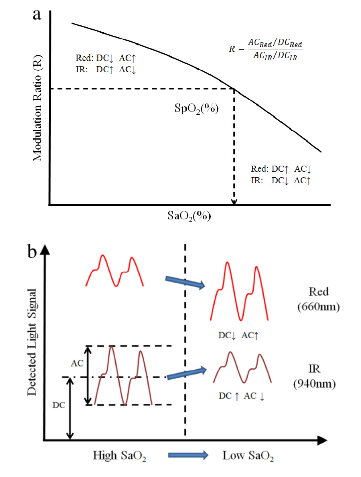
(抜粋)It is necessary to obtain the values of Red_AC and Red_DC and IR_AC and IR_DC.
The formula for calculating SPO2 is as follows
$$R=\frac{Red_{AC} \div Red_{DC}}{IR_{AC} \div IR_{DC}}$$
$$SPO_{2}[\%]=-45.060R^2+30.354R+94.845$$
Normal SPO2 is 97-99%.
$$98=-45.060R^2+30.354R+94.845$$
In other words, the normal R value is about 0.54.
However, when calculated using the sensor values, the R value is 1.782
Isn’t this sensor already broken?
Just when I was about to give up, the reciprocal of 1.782 was…
$$\frac{1}{1.782}=0.561$$
Are the RED and IR values reversed?
In RED Value only mode(ledMode = 1), the red LED is not lit.
No…

I tried shooting it with an IR camera.
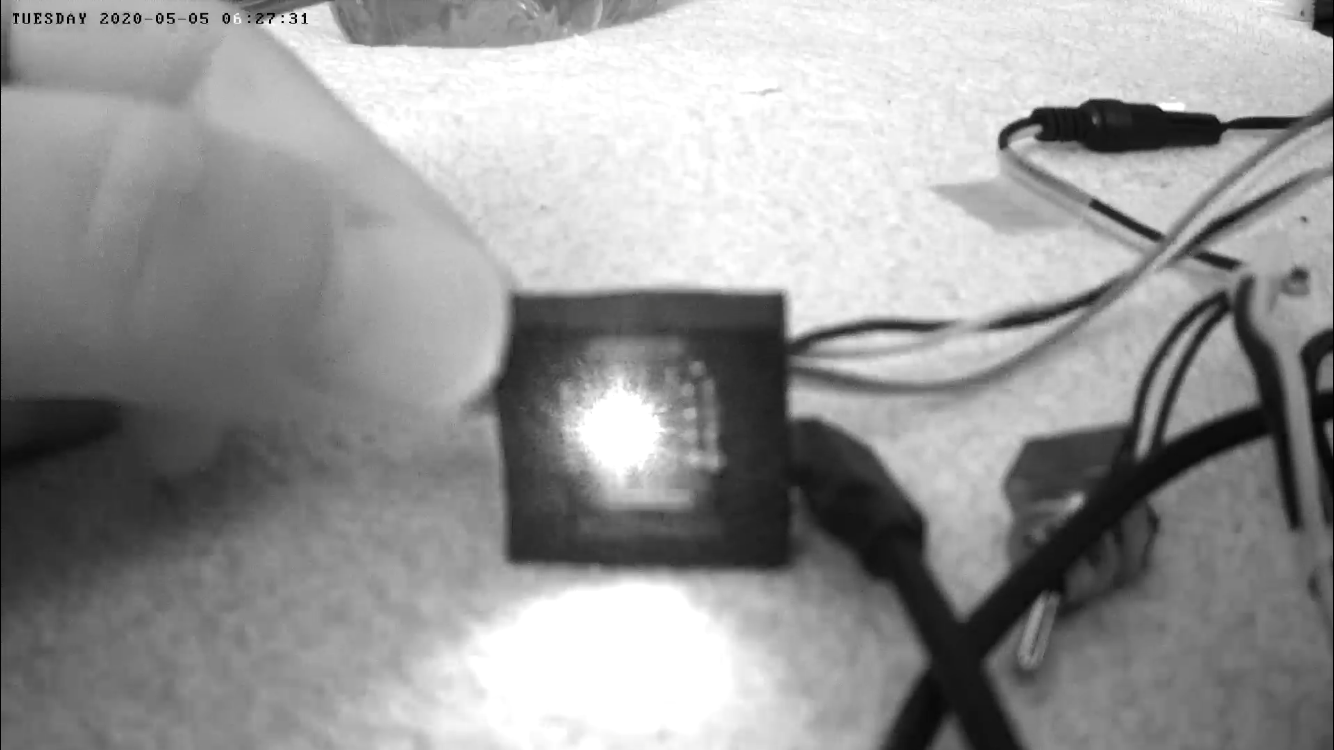
Oh… The sensor’s infrared light is glowing.
I need to reverse the IR value and Red value when programming
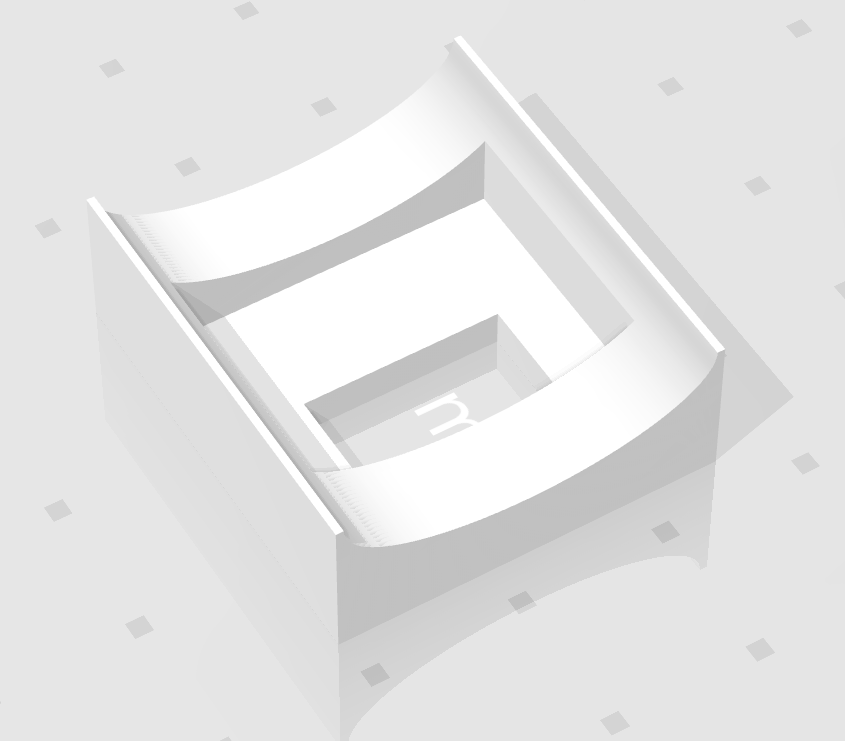
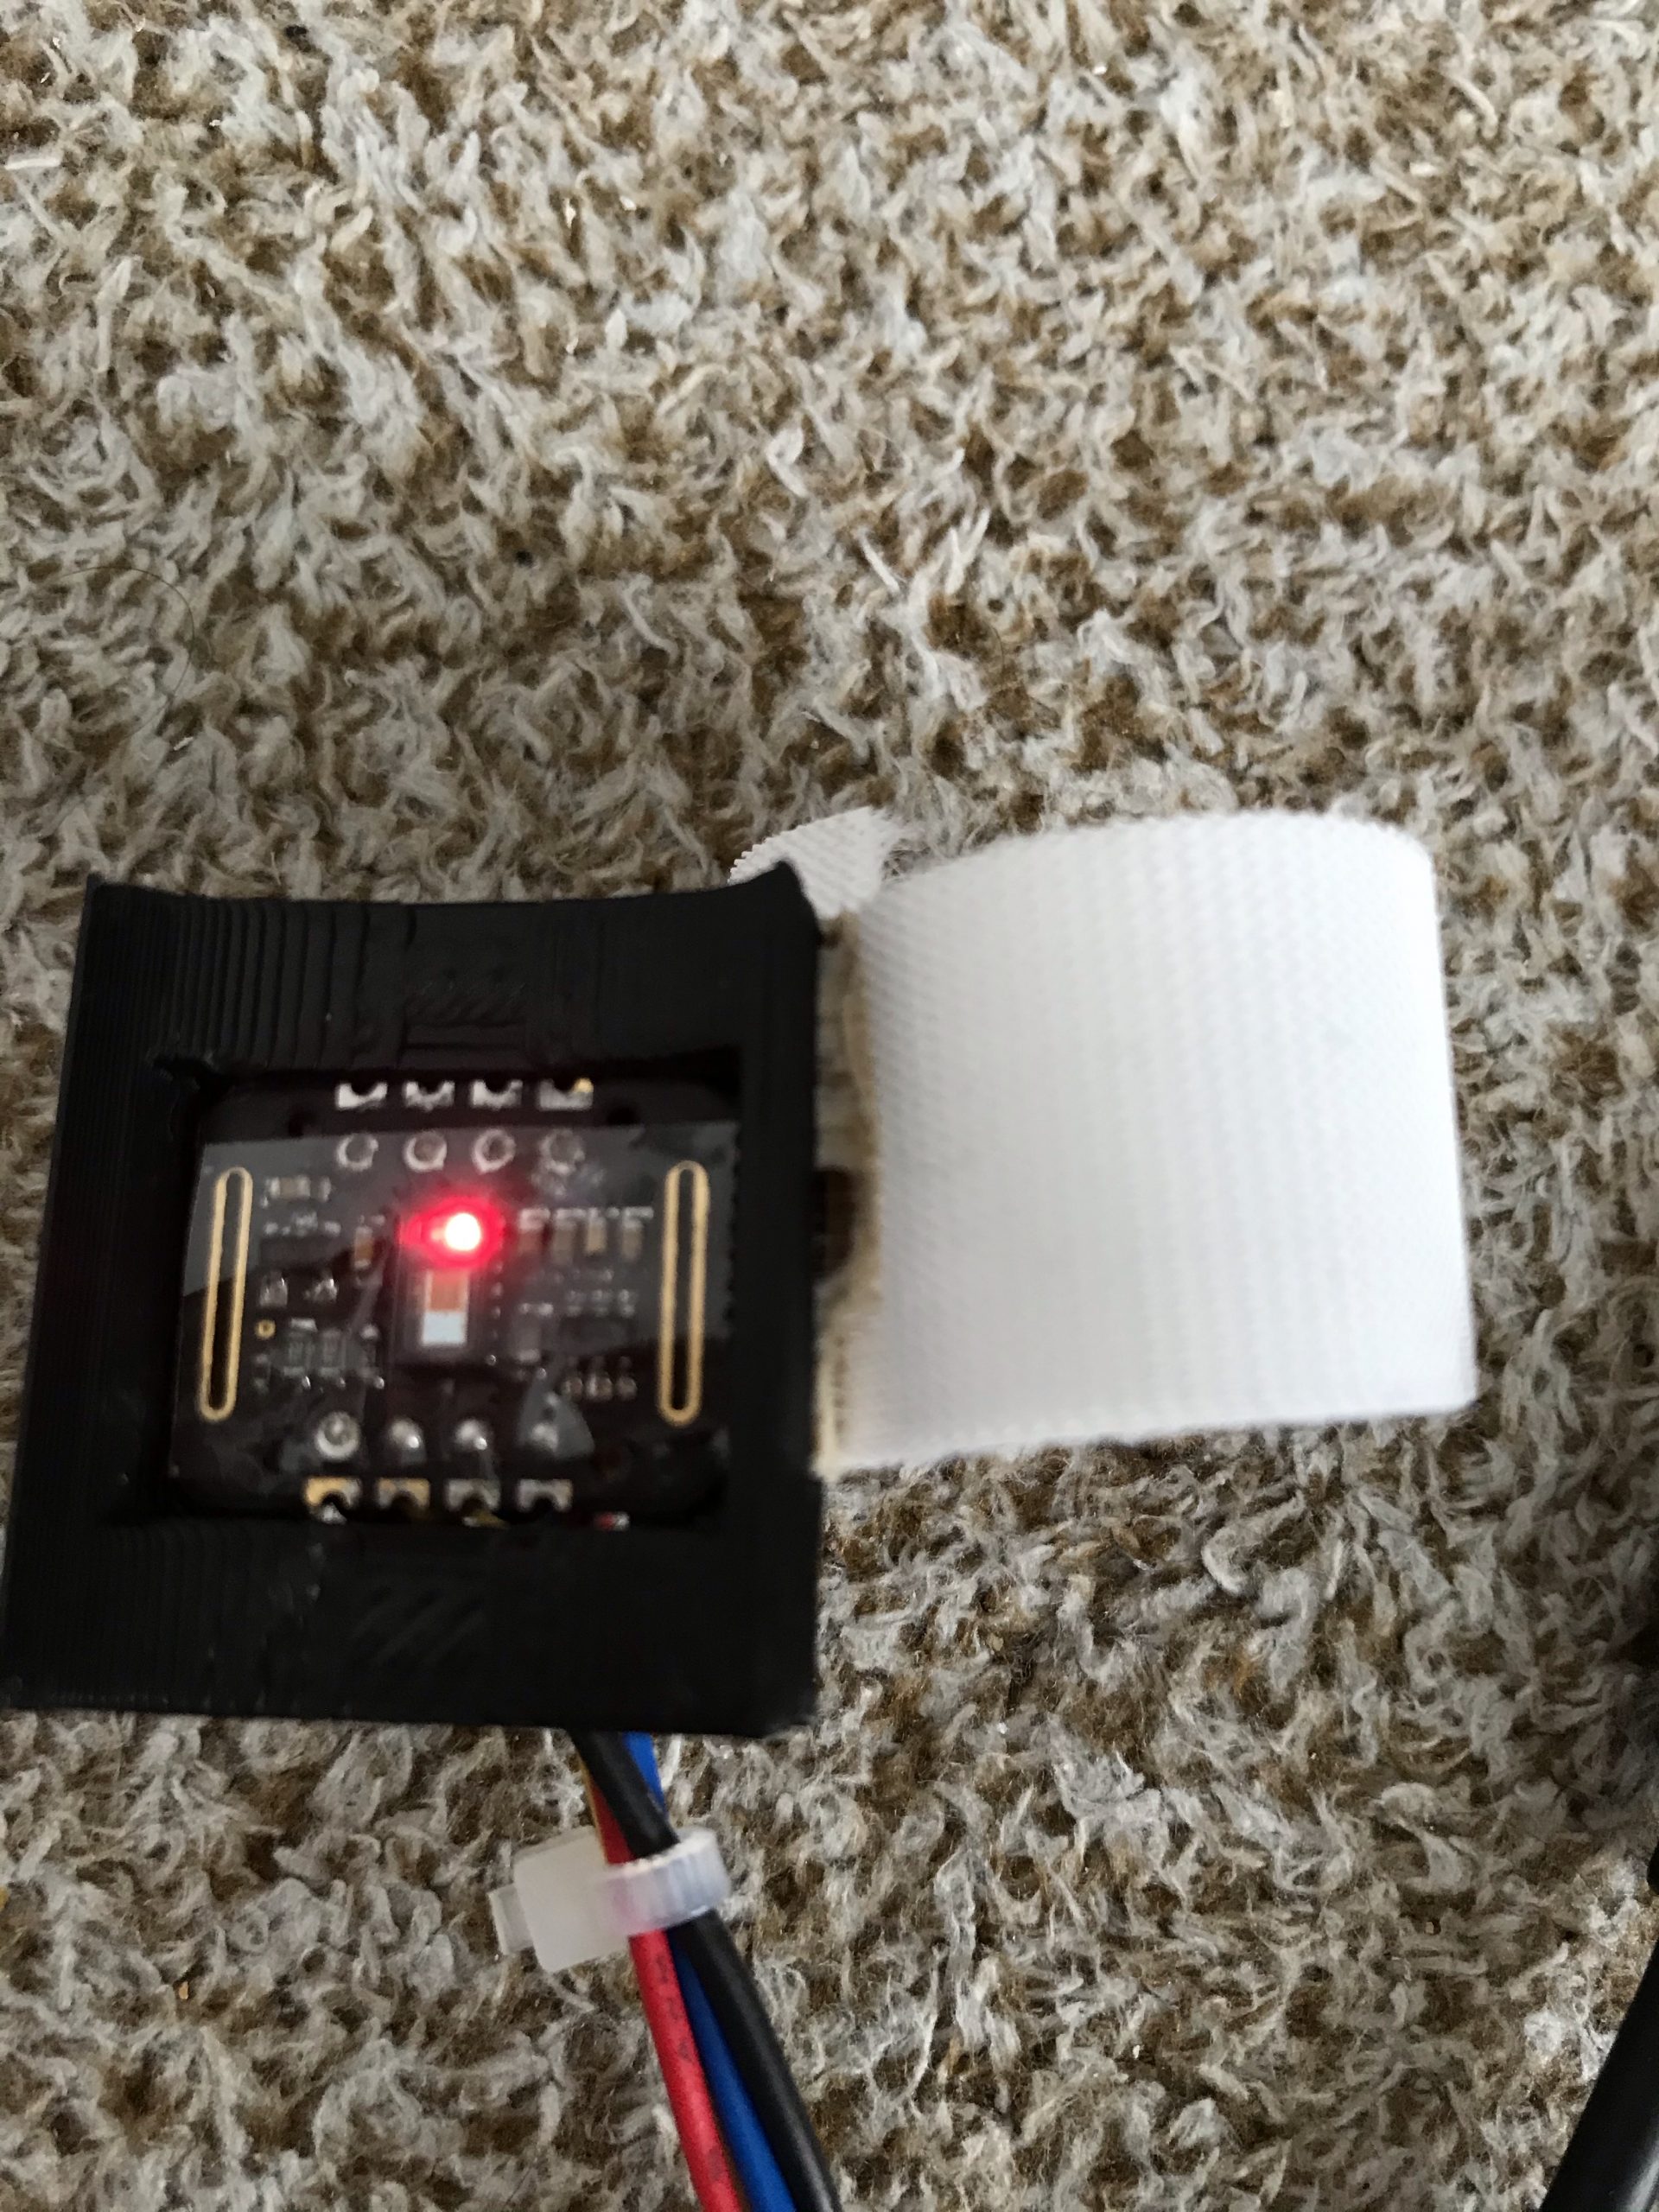
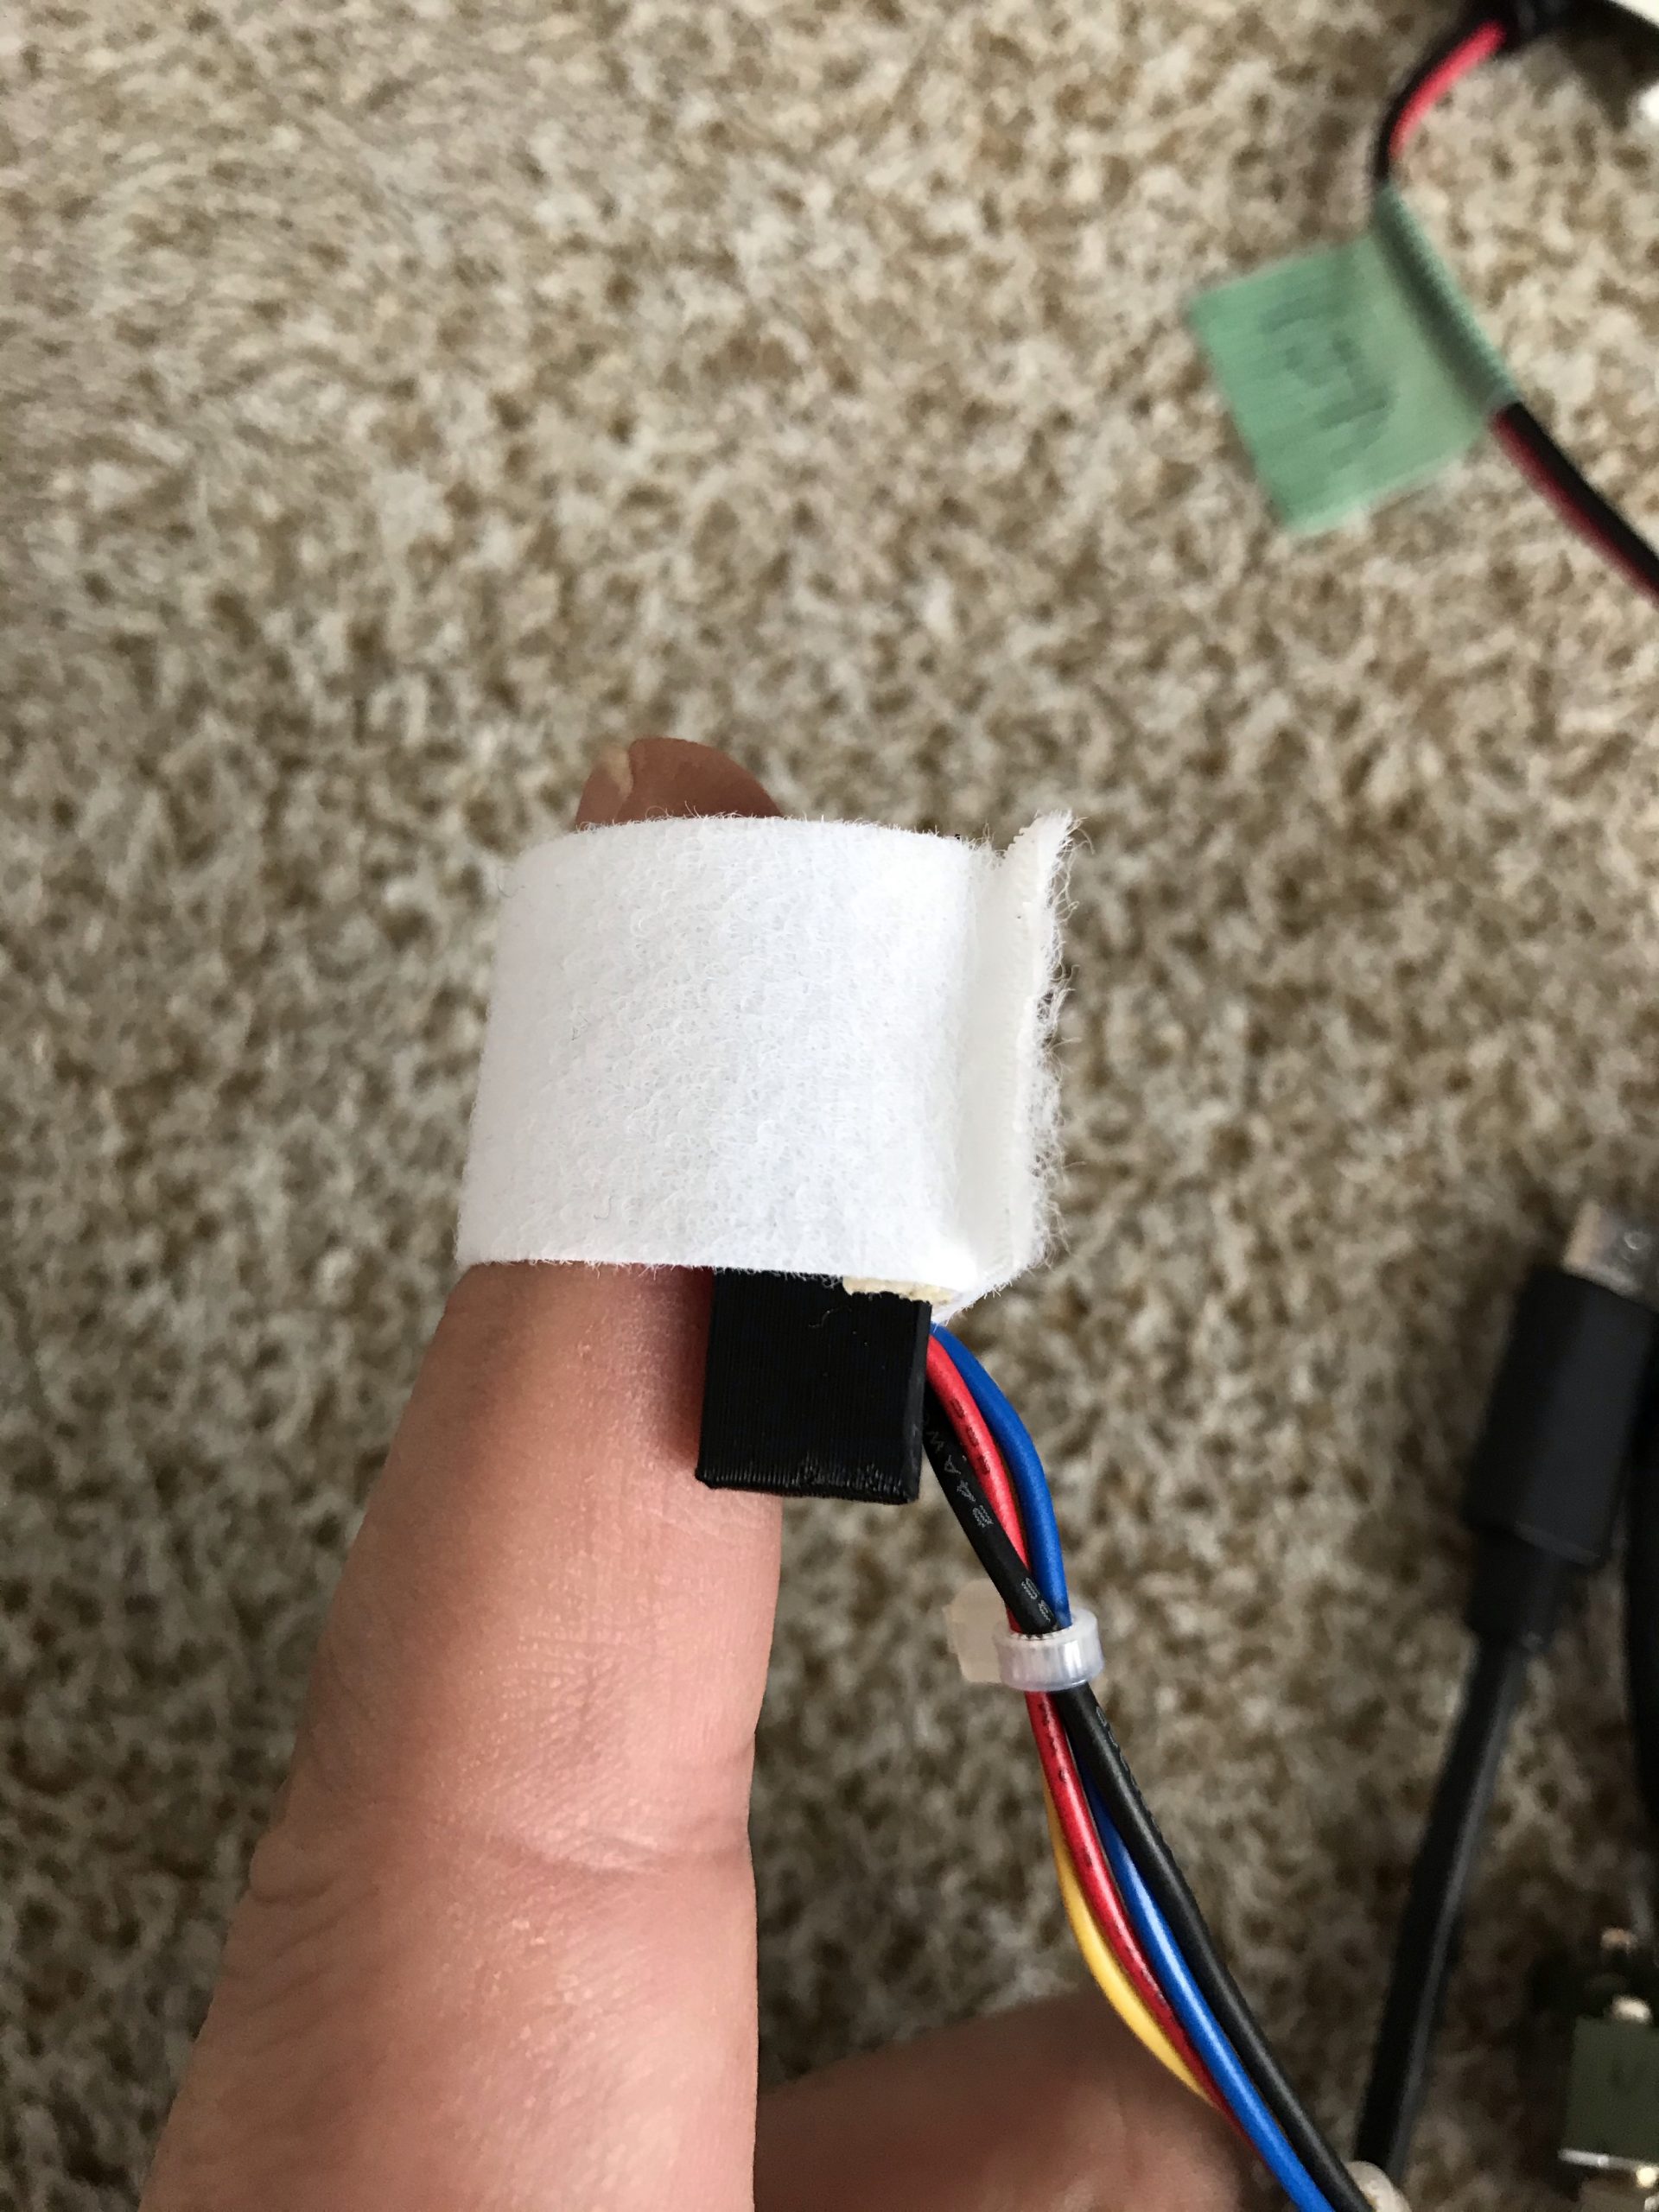
Assembly and Code
I used a 3D printer to make a sensor mounter. I put a band on my finger to hold it.


|
1 2 3 4 5 6 7 8 9 10 11 12 13 14 15 16 17 18 19 20 21 22 23 24 25 26 27 28 29 30 31 32 33 34 35 36 37 38 39 40 41 42 43 44 45 46 47 48 49 50 51 52 53 54 55 56 57 58 59 60 61 62 63 64 65 66 67 68 69 70 71 72 73 74 75 76 77 78 79 80 81 82 83 84 85 86 87 88 89 90 91 92 93 94 95 96 97 98 99 100 101 102 103 104 105 106 107 108 109 110 111 112 113 114 115 116 117 118 119 120 121 122 123 124 125 126 127 128 129 130 131 132 133 134 135 136 137 |
#include <Wire.h> #include "MAX30105.h" #include <movingAvg.h> MAX30105 particleSensor; //------ 定数定義 const uint32_t TH_FIN = 7000; //指が置いてあるかどうかの閾値 const int32_t TH_AMOUNT = 300; //パルスの起点となる検出変化量 const int32_t MIN_INIT = 9999999; //最小値の初期値 const int32_t MAX_INIT = 0; //最大値の初期値 //表示する心拍数とSpO2の範囲(用途により適宜変更) const uint32_t DISP_MIN_HR = 30; const uint32_t DISP_MAX_HR = 180; const uint32_t DISP_MIN_SPO2 = 70; const uint32_t DISP_MAX_SPO2 = 100; //パルス検出保持変数 long l_time = millis(); //最後のパルス検出時間の保持 int32_t before_ir_v = 0; //最後のir_v値保持 int32_t b_diff = 0; // 最後の差の保持 long pulse_interval = -1; // パルス間隔時間 //1パルス中の生データの最大・最小値の保持 int32_t min_ir_v = MIN_INIT ,max_ir_v = MAX_INIT; int32_t min_red_v= MIN_INIT ,max_red_v = MAX_INIT; //移動平均値(IR_DC、RED_DC) 30(20~50)サンプル movingAvg avgIr_v(30); movingAvg avgRed_v(30); //移動平均値(心拍数は直近3ビート、SPO2は5ビートの平均) movingAvg avgHR(3); movingAvg avgSPO2(5); void setup() { Wire.begin(0,2); // I2Cのピン設定 Serial.begin(115200); Serial.println(""); Serial.println("Initializing..."); // センサー初期化 while(!particleSensor.begin(Wire, I2C_SPEED_FAST)){ Serial.print("."); } Serial.println("OK!"); byte ledBrightness = 0x1F; //Options: 0=Off to 255=50mA byte diffmpleAverage = 8; //Options: 1, 2, 4, 8, 16, 32 byte ledMode = 2; //Options: 1 = Red only, 2 = Red + IR, 3 = Red + IR + Green int diffmpleRate = 400; //Options: 50, 100, 200, 400, 800, 1000, 1600, 3200 int pulse_intervalWidth = 411; //Options: 69, 118, 215, 411 int adcRange = 4096; //Options: 2048, 4096, 8192, 16384 particleSensor.setup(ledBrightness, diffmpleAverage, ledMode, diffmpleRate, pulse_intervalWidth, adcRange); //Configure sensor with these settings //初期値として一回読んでおく(ir_vをパルス計測に用いる) before_ir_v = particleSensor.getRed(); //パルス最終取得時間の初期化 l_time = millis(); //移動平均ライブラリの初期化 avgIr_v.begin(); avgRed_v.begin(); avgHR.begin(); avgSPO2.begin(); } void loop() { //逆になっている。センサーが逆を返しているので各自チェック uint32_t red_v = particleSensor.getIR(); uint32_t ir_v = particleSensor.getRed(); //指を置いているか if(red_v< TH_FIN || ir_v < TH_FIN) return; //移動平均値(IR_DC RED_DCの算出) double ir_v_dc = avgIr_v.reading(ir_v); double red_v_dc = avgRed_v.reading(red_v); //IRとREDのACを求める為に最大値・最初値の更新 if(ir_v<min_ir_v) min_ir_v = ir_v; if(ir_v>max_ir_v) max_ir_v = ir_v; if(red_v<min_red_v) min_red_v = red_v; if(red_v>max_red_v) max_red_v = red_v; //パルス検出にはir_vを利用。前回との差分(変化値)を求める int32_t diff = before_ir_v - ir_v; //TH_AMOUNT以上の変化がある場合、パルス起点とする if(b_diff < TH_AMOUNT && diff > TH_AMOUNT){ //1パルスの時間を計算 pulse_interval = millis() - l_time; l_time = millis(); //1パルスの時間より心拍数の計算。avgHRは整数のみなので1000倍して1000で割り少数保持 double hr = (double)avgHR.reading(60000*1000/pulse_interval) / 1000.0; //SPO2の計算 //IR・REDのACを求める(振幅最大-振幅最小) int32_t ir_v_ac = max_ir_v-min_ir_v; int32_t red_v_ac = max_red_v-min_red_v; // R = (AC_RED / DC_RED) / (AC_IR / DC_IR)の計算式より double red_div = double(red_v_ac)/red_v_dc; double ir_div = double(ir_v_ac)/ir_v_dc; double R = red_div / ir_div; // SPO2 = -45.060*R^2 + 30.354*R + 94.845 これはspo2_algorithm.cppにあったのを準用 // 乗除1000は少数保持のため double spo2 = (double)avgSPO2.reading((-45.060*R*R + 30.354*R + 94.845)*1000.0) / 1000.0; //最大値・最小値の初期化 min_ir_v = MIN_INIT; max_ir_v = MAX_INIT; min_red_v = MIN_INIT; max_red_v = MAX_INIT; //心拍数とSPO2の表示(範囲は定義で変更可) if(hr <= DISP_MAX_HR && hr >= DISP_MIN_HR && spo2 <= DISP_MAX_SPO2 && spo2 >= DISP_MIN_SPO2){ Serial.print(hr); Serial.print(","); Serial.println(spo2); } } //パルス検出用値の保持 before_ir_v = ir_v; b_diff = diff; } |
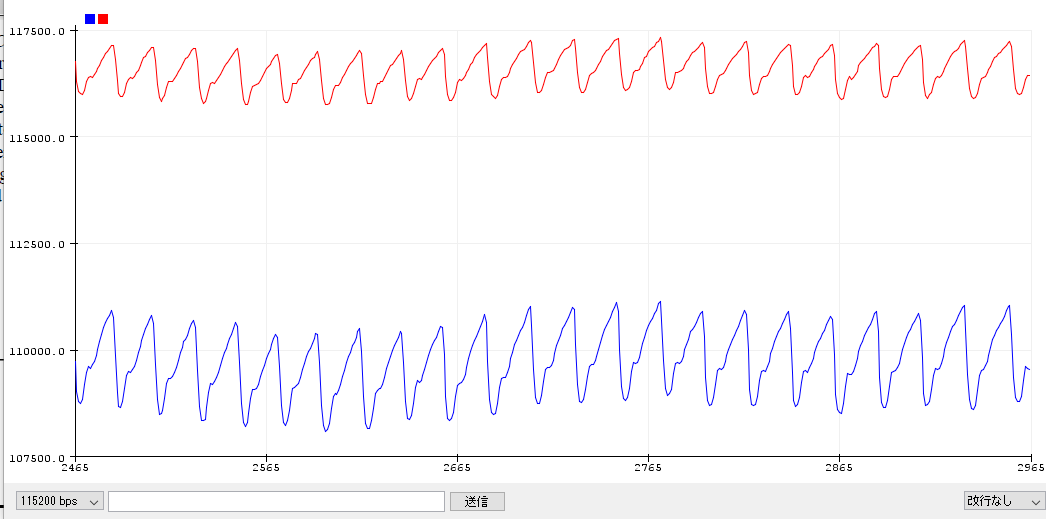
The chart below shows the heart rate and SPO2 graph and each moving averages
I have a moving average library to thank.

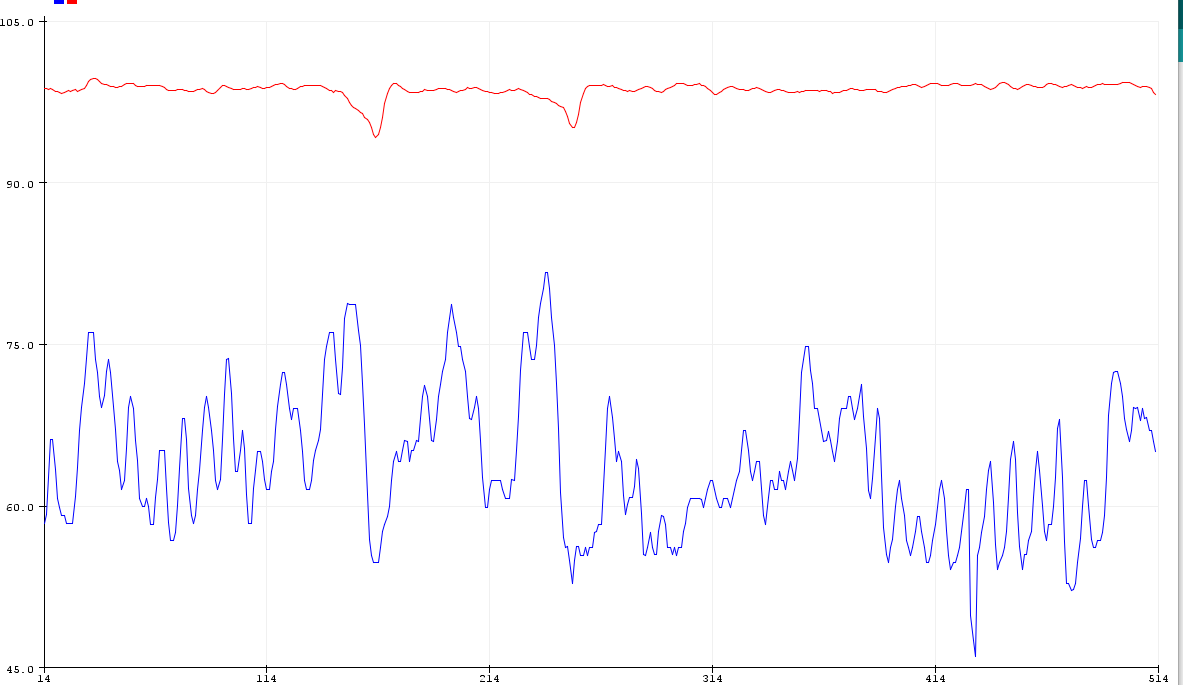
The red line is SPO2.
The blue line is heart rate.
When I held my breath, my SPO2 was dropping.
My heart rate is also a representation of my breathing.

RED and IR values should be checked !!
It’s important!!
[2020/05]
Display SPO2 and heart rate on a real-time graph

[2020/05/20]

The official library has reported the same problem. I’m publishing this article on 5/4-5. I’m hoping that maybe the questioner has seen this article.
I’m praying for a resolution.